
Setting Up Analytics for Your POD Store
Running a print-on-demand (POD) store without analytics is like flying blind. You might have a beautiful storefront and great designs, but without data, you’re guessing what works and what doesn’t. In today’s competitive e-commerce landscape, setting up website analytics is essential if you want to track performance, make smarter decisions, and grow sustainably.
Analytics helps you see where your traffic comes from. It also shows which products sell best. With this insight, you can boost your marketing and manage your inventory better. Whether you’re new to data or ready to level up your tracking, this guide will walk you through how to harness analytics for your POD success.
Let’s get your data working for you.

Why Analytics Matter for POD Stores
Data-Driven Decisions Beat Guesswork
You can’t optimise what you don’t measure. Analytics tools help answer questions like:
- Where are my visitors coming from?
- Which products are most popular?
- What’s my bounce rate or abandoned cart rate?
- How effective are my ads?
These answers empower you to stop wasting budget and focus on what works.
Improves Marketing ROI
Instead of spraying ads everywhere and hoping something sticks, analytics lets you:
- Track conversion rates from social, email, and organic search
- Identify best-performing campaigns
- Allocate budget to high-converting channels
Enhances Customer Experience
By tracking user behaviour, you can:
- Identify friction points in your checkout flow
- See what content resonates most
- Discover which devices users prefer (mobile vs desktop)
Happy customers = repeat customers.
Essential Metrics to Track
1. Traffic Sources
- Organic search
- Paid ads (Google, Facebook, TikTok)
- Direct visits
- Referral traffic
2. Bounce Rate & Time on Page
- High bounce rate = users not finding value fast enough
- Long time = engaging content
3. Conversion Rate
Percentage of visitors who complete a desired action:
- Purchase
- Email signup
- Product view
4. Cart Abandonment Rate
Key for improving checkout flow. You can even trigger reminder emails.
5. Average Order Value (AOV)
Helps you set better upselling and bundling strategies.
6. Customer Lifetime Value (CLV)
The ultimate metric for long-term profitability.
7. Returning vs New Visitors
Tells you how well your retention strategies (like email or loyalty programs) are working.
Tools to Set Up Analytics
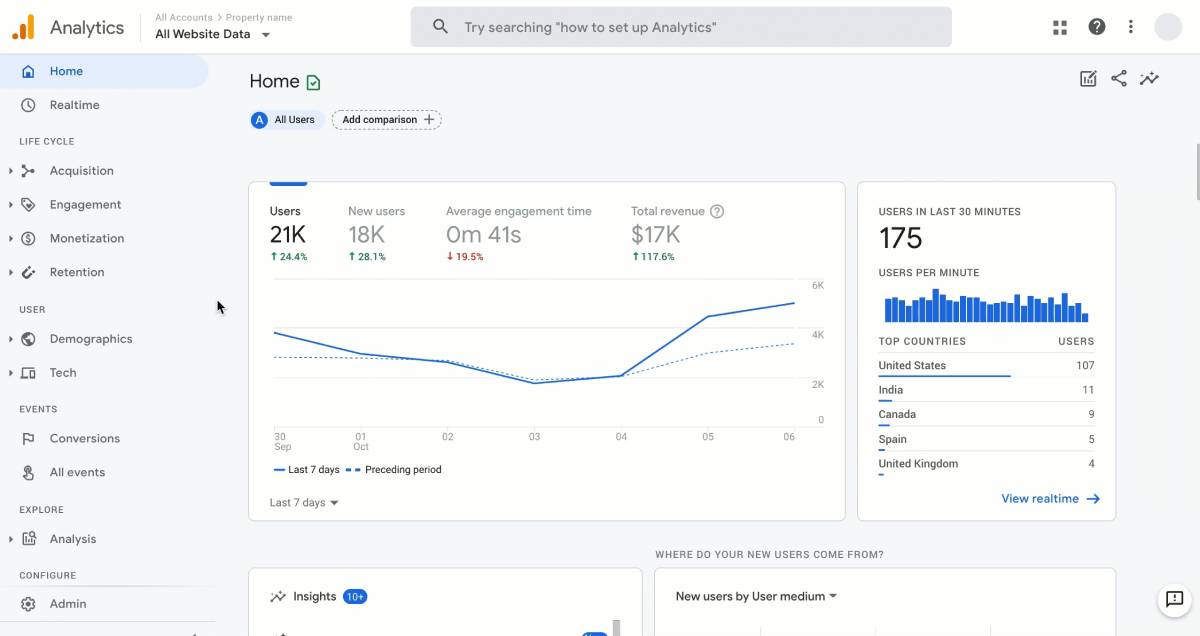
Google Analytics (GA4)
The go-to platform for most e-commerce tracking.
How to Install:
- Use Google Tag Manager for easy deployment
- Connect to Shopify or WooCommerce through a plugin/integration
What You Can Track:
- Traffic sources
- Conversions
- Funnels
- Events (button clicks, scrolls)
Meta Pixel (Facebook Pixel)
Essential if you’re running Facebook or Instagram ads.
Use it to:
- Retarget website visitors
- Track ad conversion events (add to cart, purchase)
- Optimise campaigns based on real sales data
TikTok Pixel
TikTok is booming for POD sales. Their pixel helps you:
- Build custom audiences
- Track conversions
- Improve ad targeting
Shopify Analytics / WooCommerce Reports
Built-in dashboards for:
- Sales data
- Product performance
- Customer behaviour
Use these alongside external tools to get a full picture.
Setting Goals & Funnels
Define What Success Looks Like
Set SMART goals:
- Increase monthly sales by 20%
- Reduce cart abandonment by 15%
- Grow email list by 500 subscribers
Create Conversion Funnels
Break down the customer journey:
- Homepage > Product page
- Product > Add to cart
- Cart > Checkout
- Checkout > Thank you
Use Google Analytics or Hotjar to see where drop-offs happen.
Segmenting Your Data
Raw data means little unless you break it down.
Segment by:
- Traffic source (e.g. Instagram vs Pinterest)
- Device (mobile vs desktop)
- Location (UK vs US traffic)
- Customer type (new vs returning)
This helps you tailor marketing to each group.
Example: If mobile users from TikTok are bouncing, your mobile design may need work.
Using Heatmaps & Behaviour Tools
Hotjar / Crazy Egg
These tools show:
- Heatmaps (where users click/tap most)
- Scroll depth (where people drop off)
- Session recordings (see real user journeys)
Great for UX improvements and boosting conversions.
A/B Testing for POD Stores
Once you have data, start testing.
Test Elements Like:
- Product titles or mockup images
- CTA button colour or copy
- Discount offers vs free shipping
Tools to Use:
- Google Optimise (free)
- Convert.com
- VWO
Run tests for at least 2 weeks with enough traffic to be statistically significant.
Automating Data Insights
Don’t spend all day reading graphs. Let your tools do the work.
Use Alerts & Reports:
- Set up weekly GA4 reports emailed to you
- Use Shopify reports to track top products
- Automate Facebook ad metrics into Google Sheets
This keeps you informed without overwhelming your time.
Real-Life Example: Jay’s Streetwear POD Shop
Jay sells Gen-Z-inspired streetwear via Shopify and TikTok. He added GA4 and Meta Pixel, then launched £300 in ads.
Findings:
- 75% of traffic came from TikTok
- Mobile bounce rate was 68%
- One hoodie had a 6.8% conversion rate, double others
Action:
- Improved mobile page load speed
- Created bundles around the top-converting hoodie
- Increased TikTok budget for winning ad
Result:
- 3x return on ad spend in 2 weeks
- Lowered cart abandonment by 22%
Common Mistakes to Avoid
- Not setting up goals: You can’t measure success if you don’t define it.
- Tracking too much: Focus on actionable metrics.
- Ignoring mobile: Most POD traffic is mobile-first.
- No UTM tracking: You’ll lose visibility into what actually drives conversions.
Conclusion: Let Data Be Your Co-Pilot
Setting up analytics for your POD store is more than a technical task. It’s the key to smart and sustainable growth. In a world where trends change quickly and customers can switch overnight, data is your best guide. It tells you what’s working, where you’re losing customers, and how to refine your efforts for maximum impact.
Track key metrics, set clear goals, and use the right tools. This way, you’ll gain clarity to make confident decisions. Analytics helps you target paid ads better and optimise product listings. So, you can guess less and focus more on growth.
So don’t wait for a downturn to get analytical. Start now—install the basics, get familiar with your reports, and use insights to shape your next big move. Your POD business doesn’t need more luck. It needs more data. And now, you know exactly where to begin.
Have questions about analytics tools or want to share your favourite metrics? Drop a comment below—we’d love to hear how you’re tracking success.