
How to Analyse Data to Improve Your POD Sales
Why Data Holds the Key to Your POD Growth
Running a successful print-on-demand (POD) business isn’t just about stunning designs or clever product names. Behind every viral mug or top-selling hoodie is something less glamorous—but far more powerful: data.
Data analysis helps you uncover what’s working, what’s not, and where you’re leaving money on the table. From customer behaviour to product performance, understanding your numbers helps you make informed decisions instead of flying blind.
As of May 2025, sellers who monitor and act on their analytics consistently outperform their competitors. In this guide, you’ll learn how to decode your numbers and turn insights into higher conversions and more sales.
Understanding the Core: What Data Analysis Means for POD
Data analysis for POD is the practice of reviewing metrics like clicks, conversions, product views, customer behaviour, and fulfilment speed to identify ways to optimise your performance.
Done correctly, it can help you:
- Identify your best and worst-selling products
- Understand which marketing channels drive the most sales
- Spot drop-off points in your sales funnel
- Reduce abandoned carts
- Improve pricing, upsells, and product pages
Instead of guessing what your customers want, you can let the data tell you.
Quick Guide Summary: POD Data Analysis Checklist
- Connect your store to analytics tools
- Track product performance and conversion rates
- Analyse customer behaviour (traffic sources, device types, time on site)
- Monitor sales trends and seasonality
- Review abandoned cart rates
- Evaluate ad performance metrics
- Use heatmaps and session recordings
- Segment data by product, campaign, and demographic
- Adjust pricing, design, or strategy based on insights
- Set monthly review routines for ongoing improvement
Step-by-Step Guide: How to Practice Data Analysis for POD Sales
1. Connect Your Store to Analytics Tools
You can’t analyse what you can’t see. Connect your POD platform (Shopify, Etsy, WooCommerce, etc.) to essential tools:
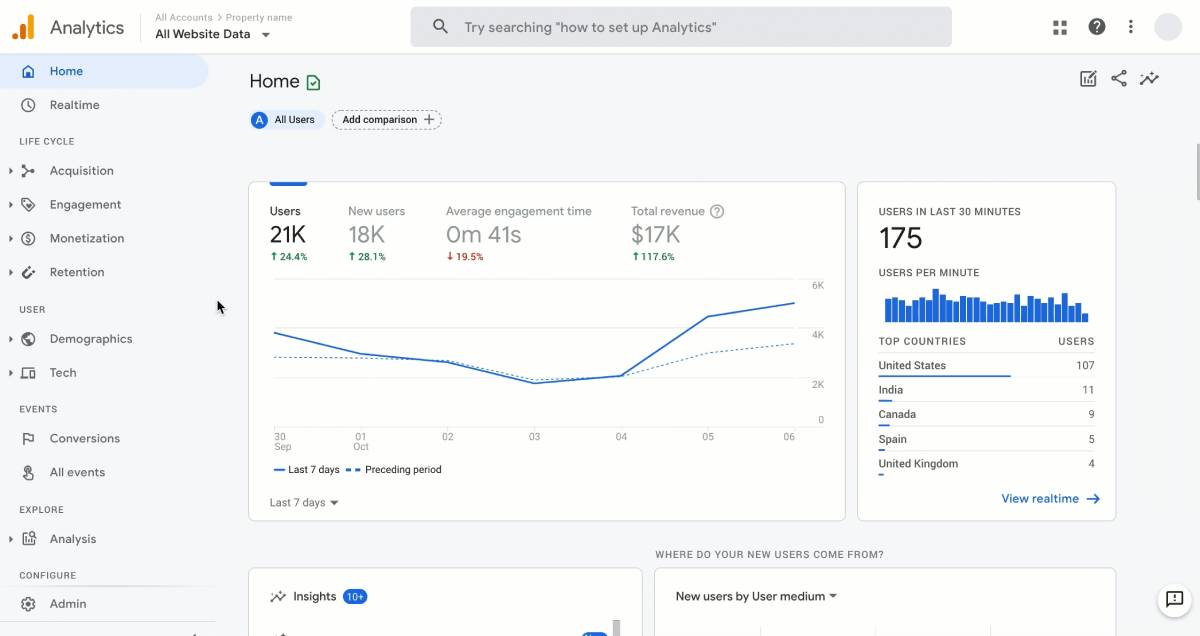
- Google Analytics 4 (GA4): Track user behaviour, sessions, bounce rate, and conversions.
- Meta Ads Manager / TikTok Analytics: For social ad campaign performance.
- Shopify Analytics or Etsy Stats: See sales, revenue per product, and traffic sources.
- Hotjar or Microsoft Clarity: Visualise how people interact with your site.
Set up basic event tracking (like Add to Cart, Checkout Initiated, Purchase Completed).
2. Track Product-Level Performance
Not all products are created equal. Review:
- Views vs Purchases: Are people clicking but not buying?
- Top-performing designs: Which products drive the most sales and why?
- Units sold over time: Spot upward or downward trends.
If a product gets traffic but doesn’t convert, consider:
- Poor mockup or photography?
- Pricing mismatch?
- Weak product description?
3. Analyse Customer Behaviour
Use GA4 or your store dashboard to identify:
- Traffic sources (search, social, referral)
- Top landing pages
- Time spent on site
- Mobile vs desktop usage
- Bounce rates
Example: If you find that mobile users bounce more, your product pages may not be mobile-optimised.
4. Study Sales Patterns and Seasonality
Use historical data to answer:
- When are your peak months or days?
- Which campaigns drove the most sales?
- Are there spikes around holidays, paydays, or seasons?
Use this info to:
- Plan promotions in advance
- Restock or prep designs based on demand
- Create seasonal content calendars
5. Review Abandoned Carts
Cart abandonment is a silent sales killer. Track:
- Abandonment rate (% of customers who don’t complete checkout)
- Average cart value
- Common drop-off points (e.g. at shipping or payment)
Then fix it by:
- Simplifying checkout flow
- Offering free or transparent shipping
- Using retargeting emails with discounts
6. Evaluate Marketing Campaign Results
Your ads shouldn’t just bring traffic—they should bring conversions.
Metrics to monitor:
- CTR (click-through rate)
- ROAS (return on ad spend)
- Conversion rate
- Bounce rate from ad traffic
- Ad frequency
If CTR is high but conversions are low, your landing page may need work.
7. Use Heatmaps and Session Recordings
Tools like Hotjar let you see where users click, scroll, or rage-click.
Common insights:
- Buttons being ignored
- Users stuck on a step in checkout
- Visitors not scrolling to important content
Important: This qualitative data gives context to the numbers.
8. Segment Your Data
Looking at averages is helpful, but segmenting tells the full story.
Segment by:
- Traffic source (e.g. organic vs paid)
- Product type (e.g. mugs vs tote bags)
- Customer location (e.g. UK vs US)
- New vs returning users
This helps you personalise your messaging and scale what works.
9. Turn Insights Into Actions
Once you’ve gathered insights, take action:
- Improve listings with low conversion
- Boost your bestsellers with paid ads
- Retire or revise poor performers
- A/B test new designs or prices
- Launch bundles based on popular pairings
Pro Tip: Keep a running document of hypotheses and results so you can learn over time.
10. Schedule Regular Data Reviews
Data isn’t “set and forget.” Build a rhythm:
- Weekly: Quick performance snapshot
- Monthly: Deep dive into product and campaign results
- Quarterly: Strategic planning based on trends
Secret Tip: Use dashboards or Notion templates to track growth visually.
Common Pitfalls
Don’t get overwhelmed. Focus on 1–2 key metrics to start, such as product conversion rate or top traffic source.
Always compare data over time. One week isn’t enough to make a decision. Look for patterns across 30, 60, or 90 days.
Not every dip is bad. Seasonal drops are normal. Learn your rhythm and plan accordingly.
Best Practices & Additional Insights
- Label campaigns clearly so you know which traffic source is driving what.
- Use UTMs in marketing links to track performance.
- Offer discounts only if they align with low-converting products, not your top sellers.
- Record customer feedback (via reviews or emails) to connect qualitative insights with your data.

FAQs
What is the most important metric for POD sales?
Conversion rate is key—it tells you how many visitors turn into buyers. However, you should also watch customer acquisition costs and average order values.
How often should I review my data?
Weekly for basic performance. Monthly for deeper trends. Adjust more often during seasonal campaigns or new launches.
Are free analytics tools enough?
For most beginner-to-mid-level POD sellers, Google Analytics + Shopify/Etsy stats + Hotjar are more than enough. As you scale, consider paid tools like Glew or Triple Whale.
Conclusion: Let Your Data Drive Your Success
Running a POD store based on guesswork is like driving with your eyes closed. When you harness the power of data analytics, you gain the clarity to grow strategically, fix what’s broken, and scale what’s working.
Start today by checking your top three products—see how many views they’ve had, how they’re converting, and what you can do better.
Data doesn’t just improve your POD store—it transforms it.