The Technology Blogs

Monitoring Customer Behaviour for Insights
Ever wondered what drives a customer to click that ‘Buy Now’ button—or why they abandon their cart at the last minute? Understanding customer behaviour is more than satisfying curiosity. It’s key to building a successful business. In e-commerce, especially for print-on-demand (POD) brands, understanding behavioural data is key. It can mean growth instead of stagnation.
This article will guide you through the practical steps of monitoring customer behaviour, using user analytics and identifying purchasing patterns. By the end, you’ll learn to turn raw data into insights. These insights help make smarter decisions, improve marketing, and boost revenue.
Why Monitoring Customer Behaviour Matters
The Power of Behavioural Insights
Knowing what your customers do—like what they browse, click, ignore, and buy—gives you clear insights into their needs and wants. It enables you to:
- Personalise marketing campaigns
- Improve product listings
- Streamline user journeys
- Boost customer retention
The Cost of Ignoring Data
Brands that don’t track customer interactions often operate blindly. Without clear data, you risk:
- High bounce and cart abandonment rates
- Misaligned product strategies
- Ineffective promotions
Customer behaviour analytics is your compass in an otherwise unpredictable market.
Tools to Track Customer Behaviour
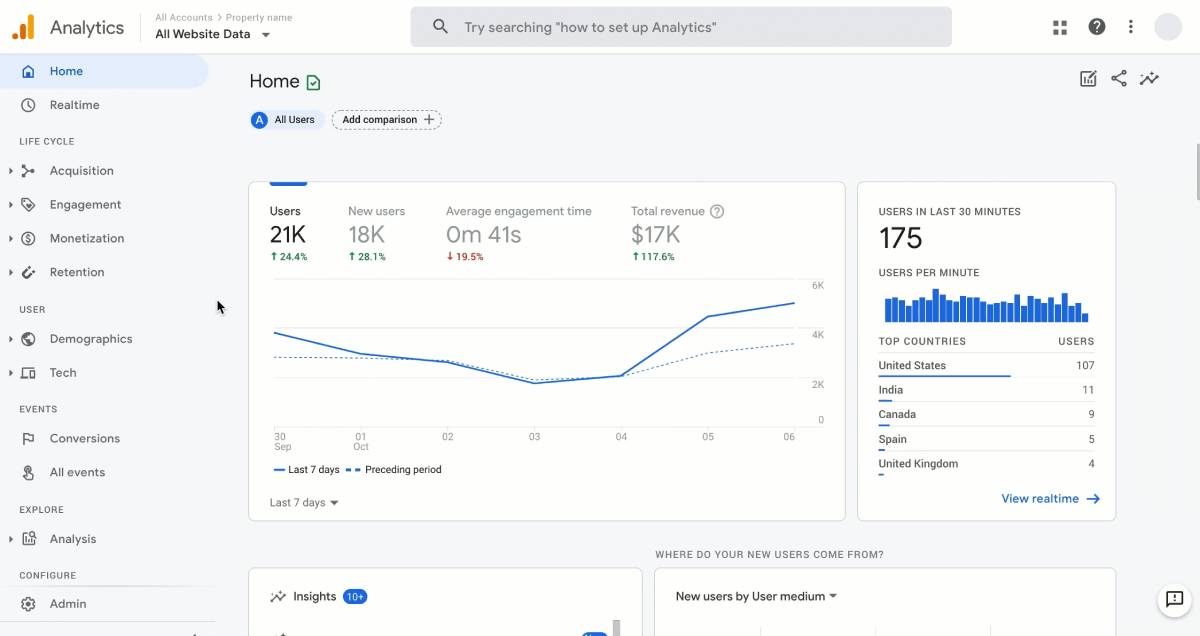
Google Analytics
A must-have tool for all e-commerce platforms, Google Analytics reveals:
- Where does your traffic come from
- What users do on your site
- Which pages do they drop off
Set up Goals to track key actions like email sign-ups or purchases.
Hotjar or Microsoft Clarity
These tools offer heatmaps, session recordings, and user feedback polls. They give you a clear view of customer journeys.
Use them to:
- Identify confusing navigation
- Spot popular elements
- Improve UI/UX
CRM and Email Platforms
Platforms like Klaviyo or Mailchimp track:
- Open rates and click-throughs
- Purchase history
- Abandoned cart behaviours
You can segment users based on behaviour for more effective email campaigns.
Shopify Analytics / WooCommerce Reports
If you’re using Shopify or WooCommerce, native dashboards show:
- Real-time sales data
- Conversion rates by channel
- Repeat customer reports
Key Customer Behaviour Metrics to Track
Bounce Rate
Indicates if visitors are engaging with your content or leaving immediately.
Time on Site
The longer users stay, the more value they likely find in your offerings.
Conversion Rate
How many visitors take a desired action (purchase, sign-up, etc.)?
Customer Journey Path
Track the steps users take from landing to checkout.
Exit Pages
Know where users drop off—and fix those friction points.
Identifying Purchasing Patterns
Seasonal Trends
Do customers buy more during specific months or holidays? Use this data to:
- Plan inventory
- Launch timely campaigns
- Offer seasonal discounts
Repeat Purchase Rate
Are your customers coming back? If not, consider:
- Loyalty programs
- Retargeting ads
- Subscription models
Product Affinities
See which items are often bought together. This helps with:
- Product bundling
- Cross-selling strategies
- Website layout optimisations
Segmenting Your Customer Base
By Behaviour
Group users by:
- Browsing frequency
- Cart additions
- Time spent per visit
By Purchase History
Create segments like:
- First-time buyers
- High-spending customers
- Dormant users
Actionable Example: Send a custom discount code to users who haven’t bought anything in over 60 days.
Using Behaviour to Tailor the On-Site Experience
After you gather behaviour data, use it to make shopping more personal and engaging.
Dynamic Product Recommendations
Display products based on your browsing history, past purchases, or items similar users have checked out. For example:
- “Recently viewed”
- “You might also like”
- “Customers also bought”
These smart suggestions can significantly increase average order value and time on site.
Smart Popups and Overlays
Instead of showing the same pop-up to every visitor, use behavioural triggers:
- Exit-intent popups with a discount for first-time visitors
- Reminder overlays for users returning to an abandoned cart
- Email sign-up forms after a user views 3+ products
Behaviour-Based Navigation Tweaks
If heatmaps show most users hover over a specific category, consider:
- Moving that category to the main menu
- Featuring it on the homepage
- Creating a bundle or collection around it
Even small adjustments based on user actions can remove friction and increase conversions.
Real-Life Example: Luna Prints
Luna Prints is a POD store that sells custom wall art. They used heatmaps and Google Analytics to track user activity. They found that users hovered over the ‘Frame Options’ section but rarely selected one. Seeing that the options were unclear, they changed the section. This led to a 22% rise in completed orders.
They also noticed that people who added two or more items to their cart were highly likely to return. So, they began offering a 10% discount on second purchases, leading to a 31% lift in repeat orders.
How to Turn Insights into Action

Optimise Your Website
- Use heatmaps to rearrange elements
- Highlight popular products
- Simplify checkout steps
Improve Marketing Campaigns
- Retarget abandoned cart users
- Use behaviour-based email flows
- Promote bestsellers to similar audiences
Product Development
- Drop underperforming products
- Add variations of popular items
- Launch based on customer demand patterns
Pitfalls to Avoid
Over-Analysis Paralysis
Don’t drown in data. Focus on a few key metrics that align with your goals.
Ignoring Context
A drop in sales might be due to seasonality, not poor product design.
Neglecting Privacy
Always inform users of cookies and tracking tools. Respect GDPR and privacy laws.
Integrating Behaviour Tracking with Other Strategies
Behaviour data enhances:
- Loyalty Programmes: Reward users based on actions
- A/B Testing: Validate what changes improve UX
- Email Funnels: Trigger messages based on behaviour
Conclusion: Data-Driven Growth Starts with Understanding
Monitoring customer behaviour isn’t about spying—it’s about serving. When you understand what your customers do and why, you gain the power to meet their needs better, faster, and more authentically.
From heatmaps to purchase patterns, behavioural analytics gives you a clear picture of your shop’s heartbeat. To improve weak product pages or increase repeat orders, use data effectively.
But remember—insight alone isn’t enough. It’s what you do with it that counts. The most successful POD brands don’t just track behaviour—they act on it. They test new layouts and improve messaging. They update product offers and refine marketing. They base these changes on what their audience really does, not on assumptions.
Start small. Choose one behaviour metric to track this week. Watch how it changes with a few strategic tweaks, then build from there. Over time, these insights will stack up into smarter strategies, happier customers, and stronger sales.
So here’s your action step: Pick one analytics tool today and start tracking your top pages. You’ll be amazed at what your customers can teach you.
Got a behaviour-driven win to share? Drop it in the comments—we’d love to hear how you’ve used data to improve your store!


YOU MAY LIKE